Chebyshev’s Theorem
Chebyshev’s Theorem provides a way to estimate the minimum proportion of observations within a specified number of standard deviations from the mean in any dataset, regardless of its distribution.
What is the Empirical Rule?
Before we learn about Chebychev’s Theorem, it will be helpful to understand the Empirical rule.
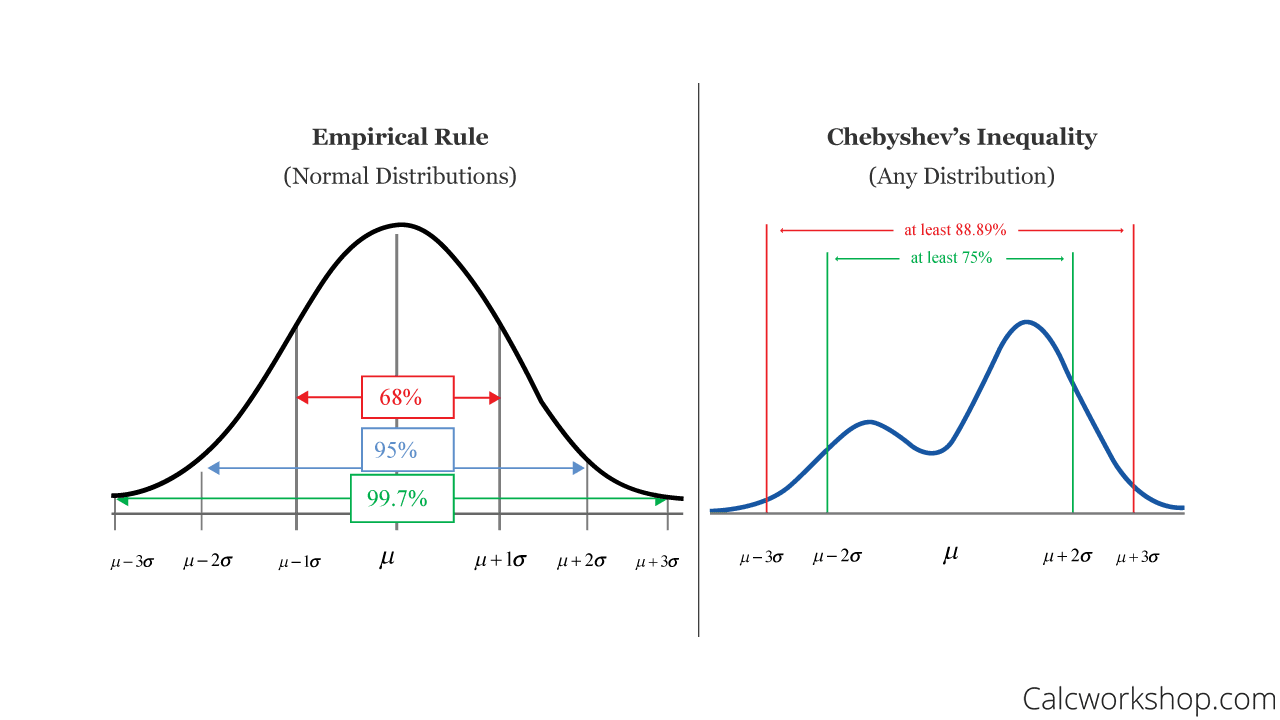
The Empirical rule is based on the assumption that the data follows a normal distribution, and it provides an estimate of the proportion of data within one, two, or three standard deviations from the mean. It states that:
- around 68% of the data lie within one standard deviation of the mean
- around 95% of the data lie within two standard deviations of the mean
- around 99.7% of the data lie within three standard deviations of the mean
However, in real-life scenarios, it is not always possible to know for certain if a dataset follows a normal distribution. If your data follow the normal distribution, that is easy using the Empirical Rule. Hence, when the data does not follow a normal distribution, Chebyshev’s Theorem provides a more general estimate for the proportion of data within a specified number of standard deviations from the mean, making it a useful tool for Statisticians, Data Scientists, and Machine Learning Engineers.
What is Chebychev’s Theorem?
Chebyshev’s Theorem is a mathematical theorem named after the Russian mathematician Pafnuty Chebyshev (1821-94). It states that a certain proportion of a dataset must fall within a specific range around the central mean value. The range is determined by the standard deviation of the data. The theorem can be stated mathematically in the form of an inequality, which is why it is also known as Chebyshev’s Inequality. The theorem applies to any dataset that follows any probability distribution where you can calculate the mean and standard deviation.
Equation for Chebyshev’s Theorem
There are two ways of presenting Chebyshev’s Theorem. One determines how close to the mean the data lie, and the other calculates how far away from the mean they fall:
Let $X$ be a random variable with finite mean $\mu$ and finite standard deviation $\sigma$, and let $k>1$ be any positive number.
-
$P(|X - \mu| ≥ k\sigma) ≤ 1 / k^2$
The equation states that the probability that $X$ falls more than $k$ standard deviations away from the mean is at most $1/k^2$.
-
$P(|X - \mu| ≤ k\sigma) ≥ 1 - 1 / k^2$
The equation states that the probability that $X$ falls within $k$ standard deviations away from the mean is at least $1-1/k^2$.
The proportion of the data falling within or beyond a certain range of the mean can be determined from the value of $k$ which expresses the size of the range as a count of standard deviations.
| k | Minimum % within k standard deviations | Maximum % with k standard deviations |
|---|---|---|
| $\sqrt2$ | $50$ | $50$ |
| $1.5$ | $56$ | $44$ |
| $2$ | $75$ | $25$ |
| $3$ | $89$ | $11$ |
| $4$ | $94$ | $6$ |
| $5$ | $96$ | $4$ |
For example, if you’re interested in a range of three standard deviations around the mean, Chebyshev’s Theorem states that at least 89% of the observations fall inside that range and no more than 11% fall outside that range.
Chebyshev’s Theorem does not provide exact answers but places limits (i.e., minimum and maximum proportions) on the possible proportions because of uncertainties about the data’s distribution. The advantage of this theorem is that it applies to ‘any’ distribution, so long as the mean and standard deviation are defined. The downside is that the estimated proportions are rather crude and for many distributions, the proportion of data close to the mean will be higher than predicted by Chebyshev’s inequality.Chebyshev’s Theorem implies that it is implausible that a random variable will be far from the mean.
The image below visually shows you the difference between the Empirical Rule and Chebyshev’s Theorem:

So How Does it Apply to Data Science?
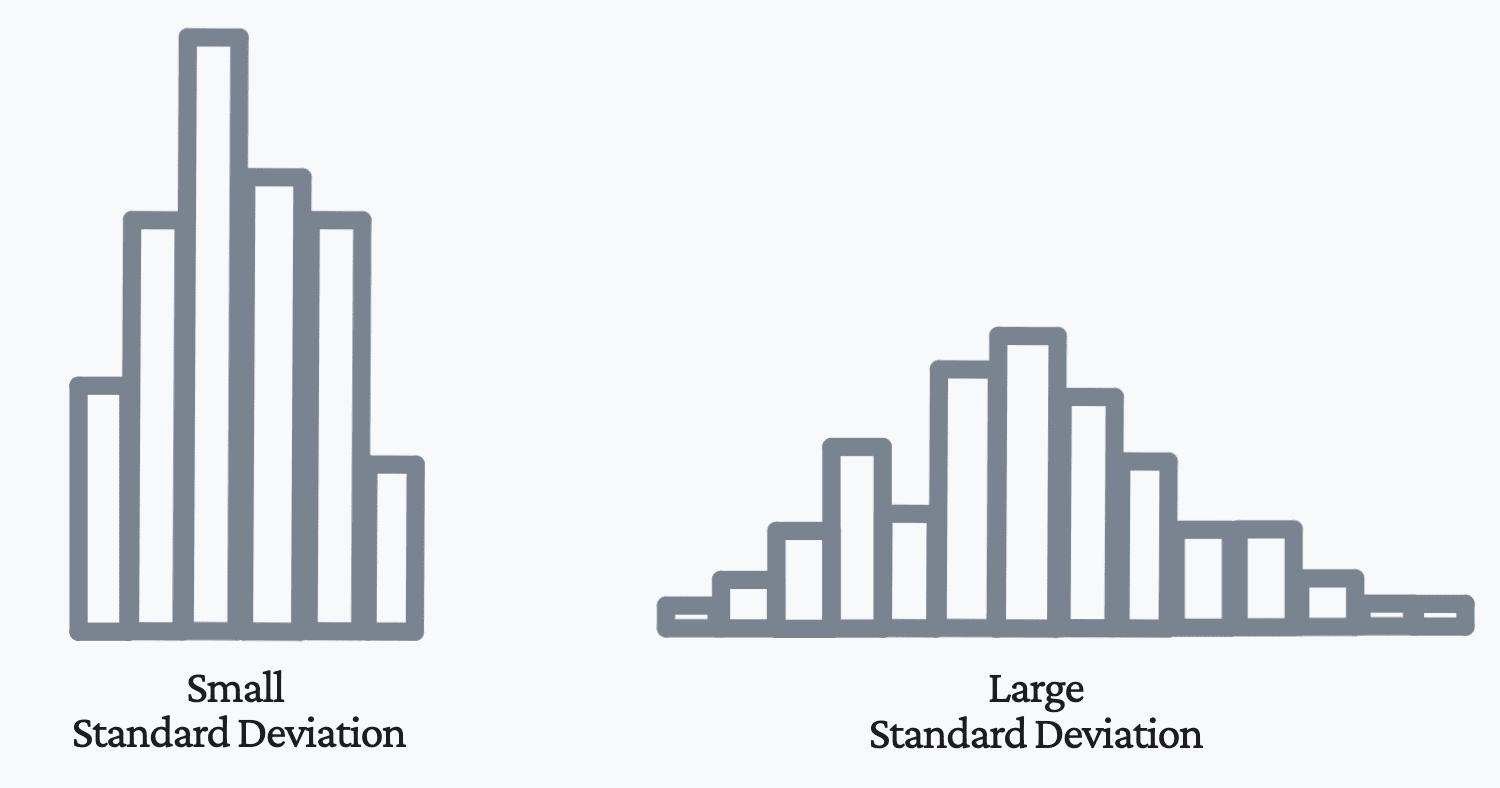
Chebyshev’s Theorem provides a way for data scientists to estimate the proportion of data within a certain number of standard deviations from the mean. In data science, the mean and standard deviation are used to describe the central tendency and dispersion of a dataset, respectively. When the variance of a dataset is high, meaning the data is spread out, Chebyshev’s theorem provides a way to determine how much of the data falls within a certain number of standard deviations from the mean. This is useful because the Empirical rule may not be applicable in cases of high variance. Chebyshev’s theorem provides a more general estimate for the proportion of data within a specified number of standard deviations from the mean, making it a useful tool for data scientists when working with datasets of high variance.

Conclusion
Chebyshev’s Theorem can be applied if you want to learn more about the dispersion of your data points, as long as you have calculated the mean and standard deviation and it does not follow a normal distribution. It will be able to determine the proportion of data falling within a specific range of the mean.
References
[1] Kdnuggets - What is Chebychev’s Theorem and How Does it Apply to Data Science?
Leave a comment